AI Overview
This article explains how Prometheus and Grafana are used for monitoring and observability on GKE. It covers their purpose, benefits, and how they work together. It also walks through installation and setup steps on a Kubernetes cluster. It helps teams gain better visibility into application performance.
Join us as we briefly discuss Prometheus and Grafana and how these fantastic open-source software can help elevate your DevOps processes. Additionally, we’ll cover a section exclusively for the techies – installing Prometheus & Grafana on a GKE Cluster.
Prometheus: Brief History & Overview
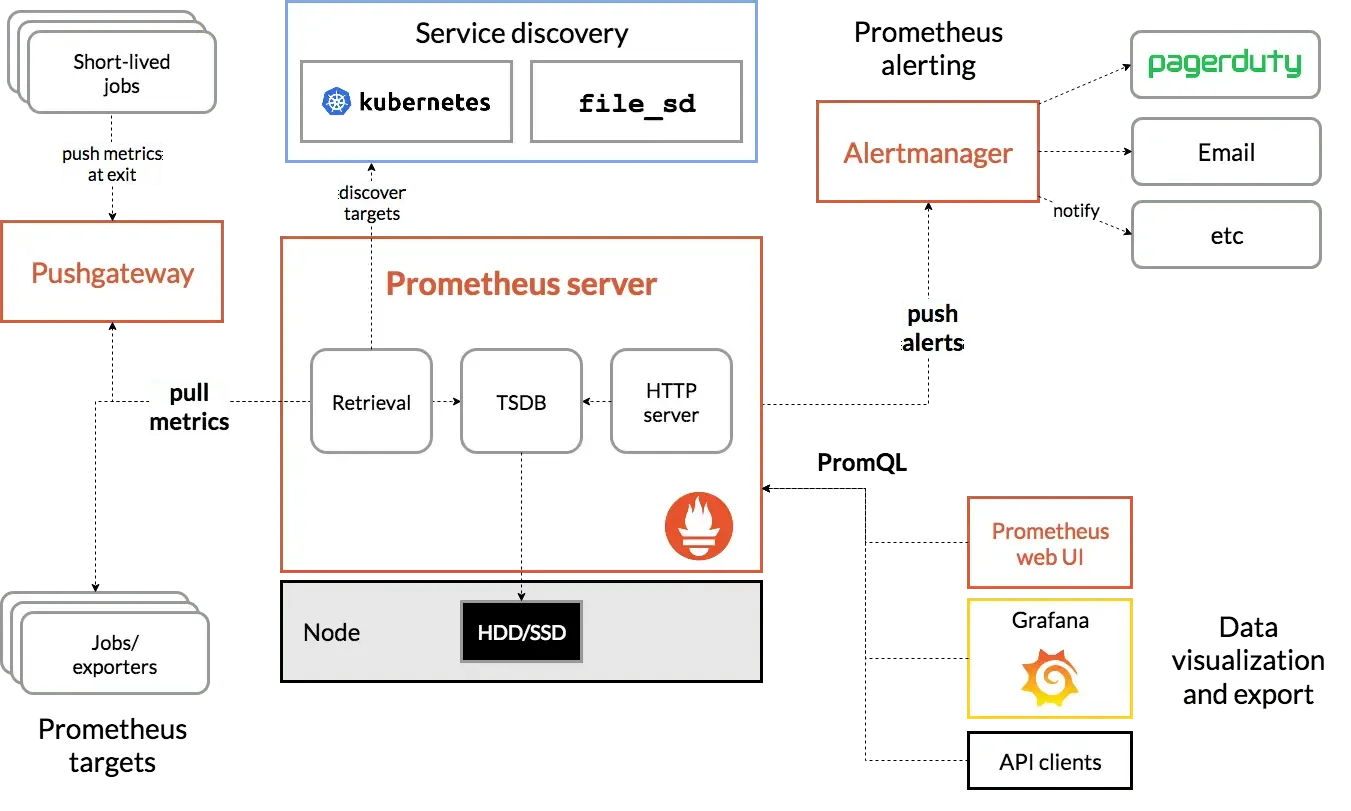
In its inception, the idea behind Prometheus was to monitor dynamic environments like Kubernetes or docker swarm. Prometheus aims to solve the ever-increasing data complexity of DevOps.
Typically, when you’re dealing with multiple servers and 100s of disparate processes, manual monitoring is cumbersome. Prometheus offers a viable solution: Automation.
With Prometheus, SREs and DevOps engineers can configure automatic monitoring of various critical alerts like backend status, auth-service status, crash errors, etc. Moreover, Prometheus also helps with issue prevention. For instance, Prometheus alerts maintainers when a particular memory usage spikes – and consequently, SREs can take proactive measures to prevent downtime.
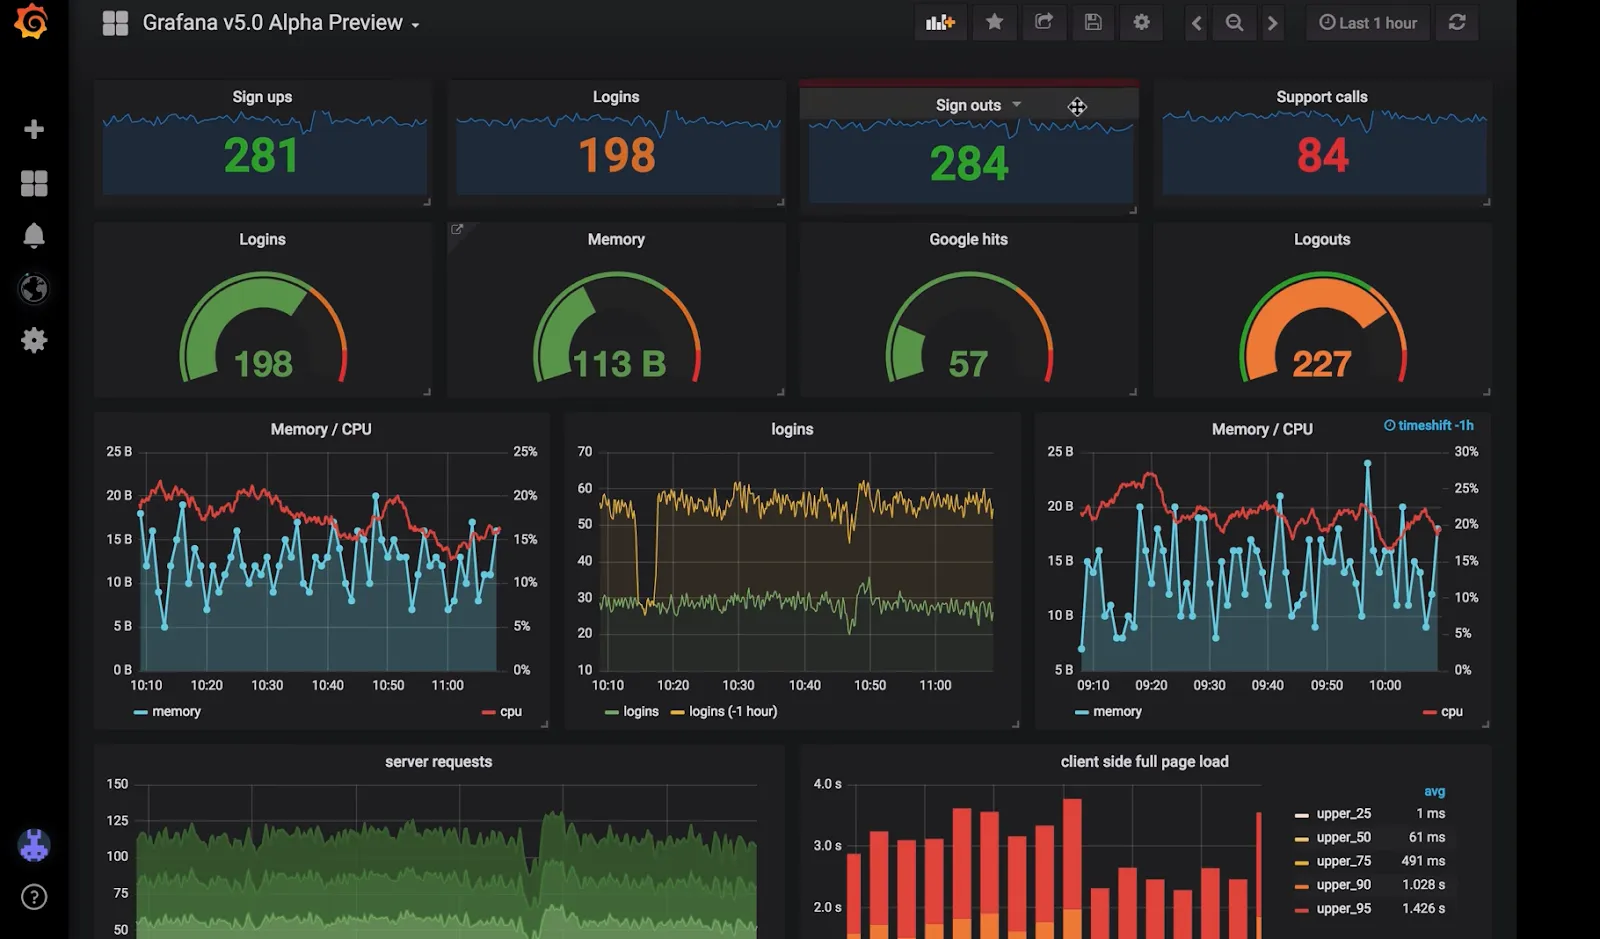
Unveiling Grafana
Grafana is a scintillating data visualization tool that queries Prometheus and presents valuable information. Moreover, Grafana serves as a single pane of glass (SPOG) for displaying different kinds of data. Grafana’s highlights include the following:
- Interactive graphs, charts, and maps
- Custom dashboards
- Alerting rules to query multiple data sources
- User access management
Dashboard Templating
Dashboard templating makes Grafana dashboards a lot more dynamic and interactive. For instance, you can create custom Dashboard template variables and redefine legend names or row titles.
Broadly, there are three types of Template variables:
Query:
The Query template generates a dynamic list of variables from your data source. You can use wildcard entries like prod.servers.* to fetch all possible values in your wildcard entry.

Interval:
The interval type helps present data around time ranges (e.g., 1 minute, 1 hour, 1 day).
Custom:
The custom option is about creating user-defined template variables on the Grafana dashboard.
Kubestate Metrics: In a Nutshell
Kube-state-metrics (KSM) comprise a simple service that fetches metrics from k8s deployments. These metrics range from health & resource usage to internal object states.
KSM – at its core, is a service that calls the Kubernetes API to generate metrics regarding Kubernetes object states. The API exposes critical parameters like:
- Pod lifecycle status
- Node status
- Available deployment replicas
The critical difference between Kubestate metrics and traditional metrics servers (pre-installed on cloud clusters) is that KSM provides data in a Prometheus format. As a result, SREs and DevOps functions can leverage customizable metric visualization and reporting tools.
Prometheus on Google Cloud
Grafana is an open-source tool that essentially adds a reporting layer to the Prometheus DB.
However, since Grafana is OSS, certain cloud providers might impose restrictions via a vendor lock-in.
The Managed Prometheus service on GCP allows you to leverage open-source tools and bypass such vendor lock-in situations.
As a result, you continue to scale your K8 deployments on Google Cloud – while harnessing the full potential of OSS like Grafana for out-of-the-box reporting and dashboard capabilities.
Installation of OSS version of Prometheus and Grafana
This one’s for all the SREs and Kube platform engineers! You guys rock! Here’s how you can deploy Prometheus and Grafana on your GKE cluster:
Installing Prometheus
We will walk you through the installation of Prometheus Operator on a K8s cluster. Prometheus Operator essentially simplifies the Prometheus deployment and configuration.
Without any further ado, here are the installation steps:
Install Prometheus Operator
Use the bundle.YAML file to install the Prometheus Operator
Key in the following command:
kubectl create -f
https://raw.githubusercontent.com/prometheus-operator/prometheus-operator/master/bundle.yaml
Configure RBAC Privileges
Create a directory to store K8s manifests.
Use these commands
mkdir operator_k8s
cd operator_k8s
Create a YAML file named prom_rbac.yaml. Paste in the Kubernetes manifest
Deploy Prometheus
Create a YAML file named Prometheus.YAML
Paste in the manifest from the official documentation
Define certain key critical parameters like name, label, and memory
Save and close the file.
Deploy it to your GKE cluster by using
kubectl apply -f
prometheus.monitoring.coreos.com/prometheus created
Creating a Prometheus Service
Create another manifest file called prom_svc.yaml and paste in the definitions
Save and close the file.
Now, create the service by:
kubectl apply -f prom_svc.yaml
service/Prometheus created
Creating a Prometheus Service Monitor
Create a new manifest file called prometheus_servicemonitor.yaml and paste in the ServiceMonitor resource definition
Define key parameters like Service Monitor, label, scrape interval.
Save and close the file.
Deploy it to your GKE cluster by using
kubectl apply -f prometheus_servicemonitor.yaml
servicemonitor.monitoring.coreos.com/prometheus-self created
Installing Grafana on Kubernetes
Here’s how you can deploy Grafana on your GKE cluster:
Create a Grafana Kubernetes manifest
Create a manifest file named grafana.yaml and paste in the definitions.
Send the manifest to your Kubernetes API server
Key in the following command:
kubectl apply -f grafana.YAML
Verify by executing this command:
kubectl port-forward service/grafana 3000:3000
Access localhost:3000 from your browser. You will land on a Grafana login page.
Use admin as the username & password for login.
Check out the official Grafana documentation for a more comprehensive tutorial.
Advantages of Prometheus & Grafana on GKE Cluster
Prometheus and Grafana are popular open-source software with a reasonably straightforward deployment and configuration setup.
Prometheus offers out-of-the-box data monitoring from various sources like Datadog, influxDB, MySQL, etc. Grafana is the ideal tool for visualizing all the data scraped by Prometheus. When these two tools work together, you can collect valuable insights.
Prometheus integrates seamlessly with Kubernetes by automatically fetching metrics from replicas as services scale up.
On a side note, here are four benefits of monitoring your Kubernetes using Prometheus + Grafana:
Real-time alerts
You can detect errors early and reduce your restoration time with proactive monitoring.
Efficient workload management
Monitoring your k8s cluster can unveil pressing concerns like resource contention or unstable pod distribution. Straightforward tweaks like anti-affinities and setting affinities can improve performance.
Better cost visibility
Kubernetes can drive up your bills in no time. Real-time monitoring of your clusters will help you keep an eye on rising costs.
Seamless Troubleshooting
Constant monitoring makes it easy to quickly access logs and conduct an RCA for any issues on your Kubernetes cluster. As a result, you encounter lesser downtimes.

Wrapping Up
The bottom line is that both Prometheus and Grafana are game-changing additions to your k8s cluster. As your cloud services scale, it becomes critical to monitor key parameters about the health of your cloud containers. Prometheus does an excellent job of scraping valuable data metrics – while Grafana is a fantastic presentation tool that displays your metrics in various formats.
Our developers behind this guide hope can be easily followed – though if you or your team need any assistance in this implementation or anything else GCP related, get in touch for a free technical consultation today.