AI Overview
This article explains how to build CI/CD pipelines and monitoring for applications on Google App Engine. It covers deployment automation, performance tracking, and reliability improvements. It shows how to achieve faster and safer releases. It helps teams maintain high quality production systems.
In the world of cloud computing, keeping things simple and automated is the key to efficiency. But many cloud-based services aren’t either of these things right out of the box. Thankfully, with access to the right knowledge and tools, you can make quick work of optimizing your cloud deployments.
The Google Cloud Platform already has the right tools and in this article, you’ll learn how to set up CI/CD pipelines and Cloud Monitoring for App Engine. We’ll also explore how to better utilize data by using Cloud Build, and Cloud Operations alongside App Engine.
Understanding The Fundamental Components
Before you can begin deploying effective CI/CD pipelines, you must have at least a basic understanding of three fundamental components: App Engine, CI/CD, and Google Monitoring (formerly, Stackdriver).
What is Google App Engine?
Google App Engine is a Platform-as-as-Service (PaaS) used to develop and host web applications in the Google Cloud. App Engine is a fully managed serverless application platform with simple administration. You can write up code in any supporting language of your choice. You can also run custom containers with the framework of your choice and easily deploy and run your code in the cloud. All of this results in faster deployments and lower administrative overhead.
For an in-depth look at how Google App Engine can empower your applications, check out our Ultimate Guide to Google App Engine.
What is CI/CD (and Cloud Build)?
Continuous Integration is a practice where developers merge all their codes and scripts in shareable repositories frequently whenever changes have to be made. Continuous Delivery is the important process of delivering the software/updates to production in smaller increments, ensuring that the software can be released at any time.
When both are present, We use Cloud Build to perform this action.
Cloud Build is Google-Managed Service Google Cloud Platform infrastructure that allows you to continuously build, test and deploy containers. Cloud Build lets you build software quickly across all languages.
What is Monitoring/Stackdriver?
Google Monitoring, now known as Cloud Operations is a service of Google Cloud that helps to monitor, troubleshoot and operate services at scale. It offers Integrated Capabilities to Cloud Monitoring, logging, and advanced observability.
Why is CI/CD Pipelines and Monitoring Needed for App Engine?
The best way to understand the importance of CI/CD pipelines and cloud monitoring for App Engine is to use an example. Let’s take XYZ, a company with different steel products as a company, that needs an application for measuring all the products that are being manufactured. Any product estimation is time-consuming, and even small errors resulting in miscalculated inventory or forecasting can cost millions of dollars to the company.
They also have to manage and check if the application is up and running at all times and because all the data has to be taken and stored during the manufacturing process. So even if the application is up and running, we need to monitor the application to get insights, for which we need different types of metrics to monitor the application with. Company XYZ creates game-changing software that accurately estimates steel requirements in 75% less time than other steel estimation software in the market. We need to make sure the application is updated with all the changes and by using CI/CD Pipeline to check if the application is running without downtime at the production level.
This isn’t just a fictional example – an application like this was built by D3V Tech. Read the full modernization case study.
Set up CI/CD Pipeline & Monitoring for App Engine
Setting up a CI/CD pipeline and monitoring for App Engine involves numerous steps – to make things easier to digest, we’ve broken down the entire process into different phases.
Steps To Create Cloud Build Triggers
The first phase of our journey begins with setting up a source repository in Google Cloud. If you are connecting an external repository, such as one hosted on GitHub or Bitbucket, you will need admin-level permissions on the repository to initially connect your repository to Cloud Build.
Complete the following steps to connect to GitHub or Bitbucket:
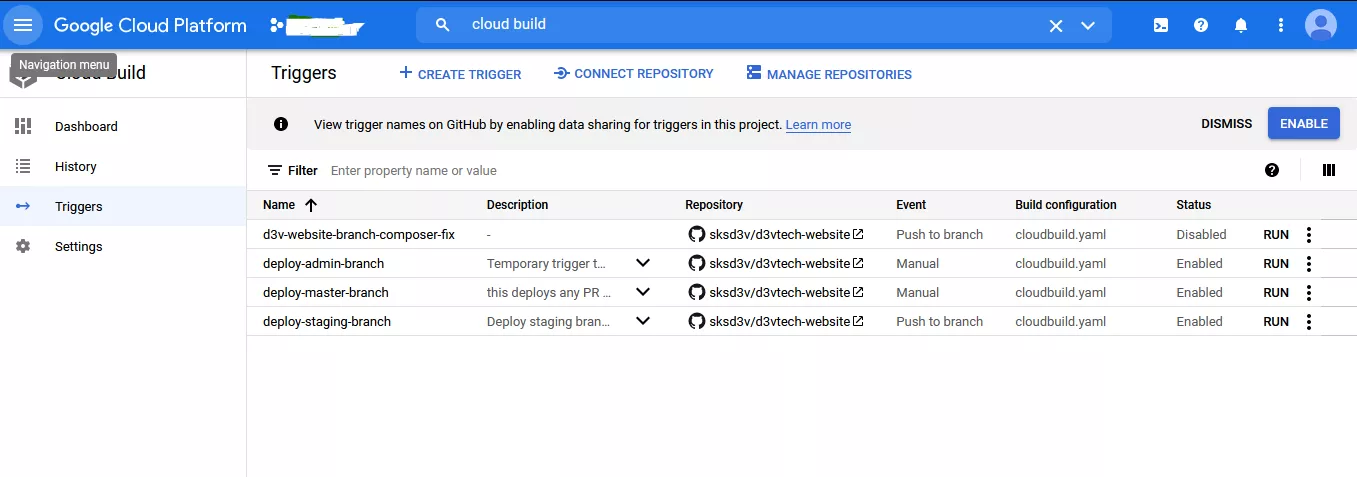
- Open the Triggers page in the Google Cloud Console.
- Select your project and click Open.
- Click Connect Repository.
- Select the repository where you’ve stored your source code.
Go to your Google Cloud console and navigate to Tools –>> Source Repository and click on Add repository. Now we need to Build the Cloud Build Trigger
Go to your Google Cloud console and navigate to Tools –>> Cloud Build –>> Triggers. If you haven’t enabled this API you will be prompted to enable this API.
Step 1:
Go to Cloud Build Trigger Service – > Click on Triggers – > Click on Create Trigger
Step 2:
Fill in the following options to create the trigger
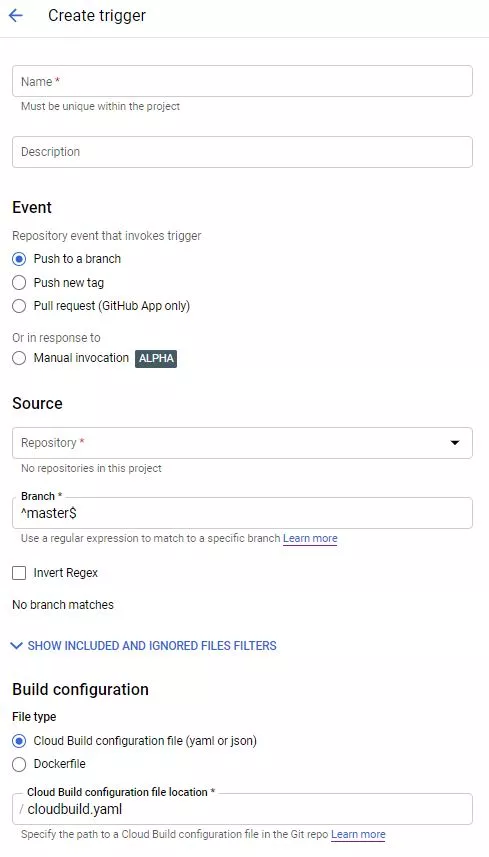
- In the Name field, we need to specify a name for the trigger.
- Under Event, there will be some options such as push to branch, push a new tag and Pull Request from Github, select Push to a branch.
- Under Source, we need to select a Repository that consists of all the files including the cloudbuild.yaml file, So once you connect to a Repository you can see all the files connected to Cloud Build and select from which branch you want to call the yaml files, enter that as your Branch.
- Under Build configuration, select “cloudbuild.yaml” as your Cloud Build configuration file.
- In the Cloud Build configuration file location field, type cloudbuild.yaml after the / so that it directs to the path where the file is present
Step 3:
Click Create to save your build trigger. This leaves the trigger disabled for the time being and ensures that any changes pushed to GitHub, will not automatically run the trigger.
Creating the continuous integration pipeline
You can configure Cloud Build to automatically run a yaml file. First, you need to build the container image and then push it to the Container Registry.
Pushing a new commit to Github or automatically triggers this pipeline. The cloudbuild.yaml file included in the code is the pipeline’s configuration.
Configure Cloud Build and App YAML files
Create a new cloudbuild.yaml file in your repository root.
Add the following contents to trigger the Google Cloud app to deploy.
Sample Code
                        steps:
                        - name: gcr.io/$PROJECT_ID/
                            args: ["install"]
                        - name: gcr.io/$PROJECT_ID/
                            args: ["update"]
                        - name: "gcr.io/cloud-builders/gcloud"
                            args: ["app","deploy", "app-${_BRANCH_NAME}.yaml"]
                        timeout:
Create a new app.yaml file in your repository root and add the following contents for deployment.
This is an example of deploying a static HTML site.( This is a sample Code )
                        runtime: nodejs12
                        handlers:
                        - url: /
                            static_files: www/index.html
                            upload: www/index.html
                        - url: /(www/.*)$
                            static_files: www/\1.html
                            upload: www/.*\.html$
At the moment, all your configurations are placed and ready.
Continuous Deployment Pipeline
Now we can go to the Github Repository and make changes either in the code or in the readme file, you can directly make changes in the readme file for running the trigger automatically.
Once the changes are done, push the changes made to a specific branch of your repository and that will get synced to the Source Repositories where you have connected the Github Repository and then deploy to App Engine.
Now we can begin setting up Monitoring and Alerts for App Engine
Set up Alerts and Monitoring for App Engine
App Engine has Monitoring included with out-of-box metrics which means we can use default metric charts that the App Engine creates by itself. We can also have our own Custom Dashboard to monitor the App Engine in the Cloud Operations.
Creating a Custom Dashboard for Monitoring
We can create custom dashboards to display specific data that interest you for your application. To create a custom dashboard, follow these steps:
On the Dashboards Overview page — >> click Create dashboard.
The following screenshot below shows a newly created dashboard with the Dashboard editor enabled.
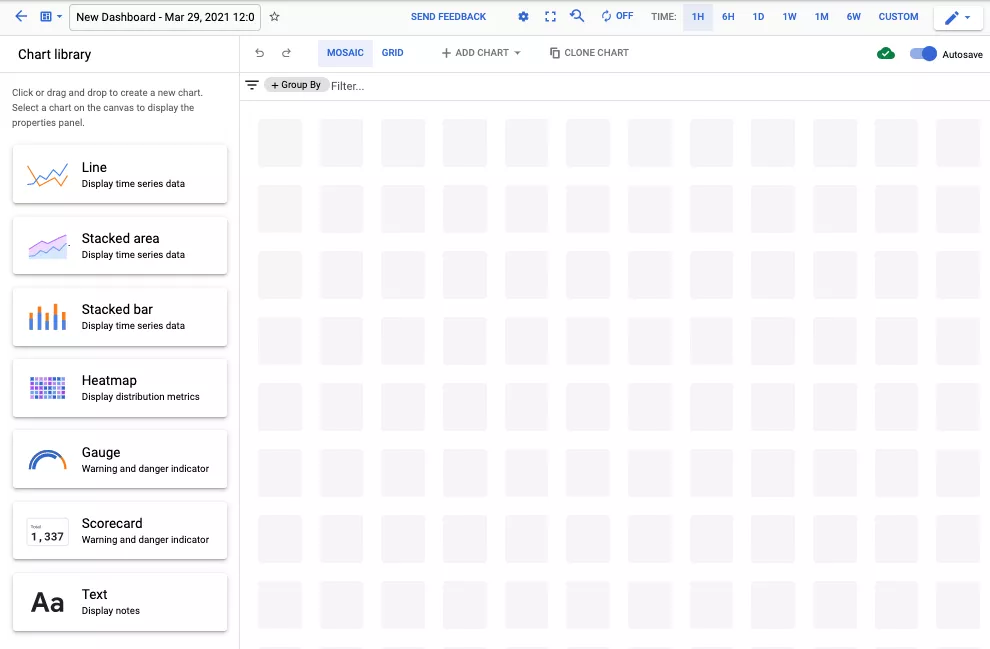
In the above picture, you can create metrics with any type of graphs that are available in the Monitoring Dashboard.
The Custom Dashboard for default is configured to automatically save changes that you make/create and let you control the size, position of the widgets that you will be adding to the dashboard.
This is Optional but, to replace the default dashboard title, which starts with [New Dashboard], with a descriptive name. You can edit/change the title once you have created the dashboard.
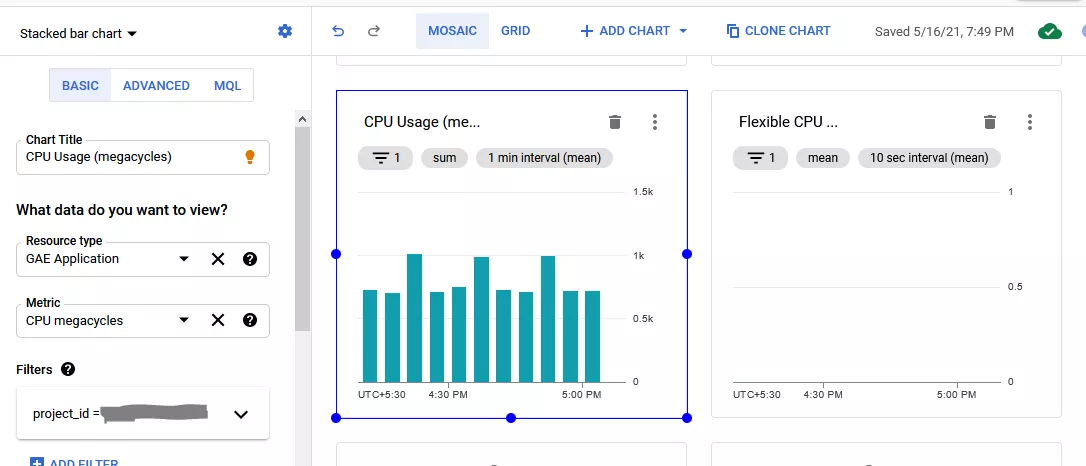
Add a widget to the dashboard by clicking it on Chart library to the graph area.
A preconfigured widget of the selected type is displayed.
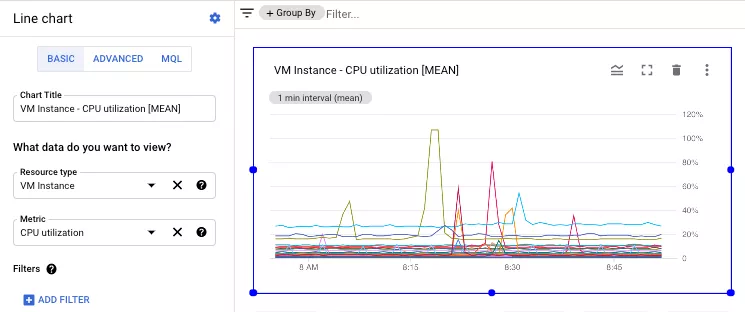
Select the widget to change the pre-selected values. For details on configuring a widget,
The following example illustrates a Line chart:
You must add at least 1 widget to the dashboard.
(Optional) In the dashboard toolbar, click Add chart to activate the Chart library.
Adding a Widget to the Dashboard
To modify a dashboard, ensure that your Identity and Access Management role for the scoping project of a metrics scope includes editing permission.
To add a widget to the dashboard, do the following:
In the Cloud Console, Search with the keyword — >> Monitoring
On the Monitoring page, click Dashboards.
Ensure that the Edit button is displayed. If it isn’t shown, click the View only menu and select Switch to Edit mode.
Click the widget in the Chart library that you want to add to the dashboard. You can also drag the widget from the library to the graph area.
Configure the widget by using the widget’s configuration pane which is displayed when the dashboard is editable and the widget is selected:
To quickly configure a widget, use Basic mode. This choice has minimal configuration options.
To have access to all widget configuration fields, use Advanced mode.
To configure a widget using MQL, use MQL mode. An MQL configuration might not be able to be represented in the other modes.
This is Optional, In the dashboard toolbar, click Add chart to activate the Chart library and then repeat the previous steps for each widget that you want to add to the dashboard.
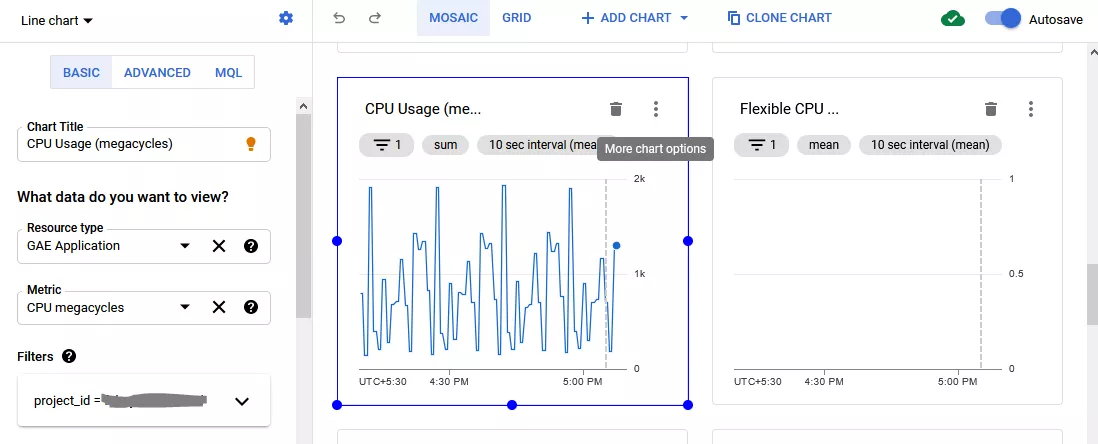
This is a example of a Line Chart for CPU Usage for the Application that has been deployed.
In the above picture , We have gauge presentations as well to represent some Insightful data.
Creating an uptime check
So once we have creating Metric charts for our Monitoring Dashboard, It is Important to create Uptime checks for the Application whether it is Up & Running.
To create an uptime check by using the Google Cloud Console — >> Monitoring
Click Uptime checks — >> Click Create Uptime check.
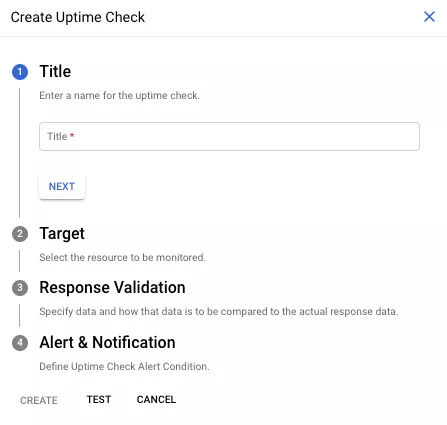
Enter a descriptive title for the Uptime check. Specify the target of the uptime check
Select the protocol. You have the options – HTTP, HTTPS, and TCP.
Choose one of the following resource types:
- URL
- App Engine
- Instance
- Elastic Load Balancer
Enter the protocol-specific fields: For HTTP and HTTPS checks, you have the option to enter a path within your host or resource. All uptime checks that use these protocols send a request to http://target/path. In this expression, for a URL resource, the target is a hostname or IP address. For an App Engine resource, the target is a hostname derived from the service name.
Enter the resource-specific fields: For App Engine resources, enter the service name in the Service field.
Leave all the other settings to Default and click SAVE to create the Uptime Checks.
Creating an alerting policy
To create an alerting policy, do the following:
In the Cloud Console search — >> Monitoring
Select Alerting.
Click Create Policy to see the Create alerting policy page
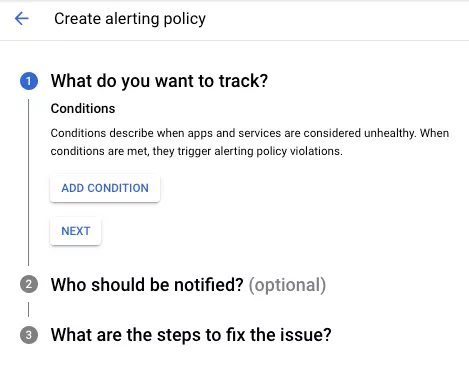
Click Add condition and complete the dialog.
A condition describes a monitored resource, a metric for that resource, and when the condition is met. An alerting policy must have at least 1 condition, however, alerting policies can contain up to 6 conditions. If an alerting policy has exactly 1 condition and if the condition is met, then an incident is created. If an alerting policy has multiple conditions, then you specify how these conditions are combined.
In this condition, you have features of creating your own metric chart for the specific service. You can choose whichever resource you want and choose your metric. You need to assign labels and other features to make the chart insightful.
Click Next to advance to the notifications section.
To be informed when an incident is created, add a notification channel to your alerting policy.
To add a notification channel, click Notification channels. In the dialog, select one or more notification channels from the menu and then click OK.
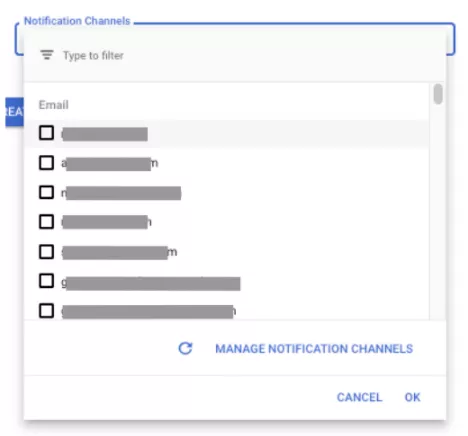
If a notification channel that you want to add isn’t listed, then click Manage notification channels. You are taken to the Notification channels page in a new browser tab. From this page, you can update the configured notification channels. When you have completed your updates, the original tab, click Refresh , and then select the notification channels to add to the alerting policy.
(Optional) If you want to be notified when an incident is opened and closed, then check Notify on incident closure. By default, notifications are sent only when an incident is opened.
Click Next to advance to the documentation section.
Click Name and enter a policy name. This name is included in notifications and it is displayed on the Policies page.
And with this final step, you’ve successfully created a CI/CD pipeline for Google App Engine and set up Cloud Monitoring along with an alerting system to closely track your app’s health and performance.
Let’s recap, here’s what we achieved.
The CI/CD pipeline will automate all the processes using Cloud Build Service. For Continuous Integration, we had app.yaml file and we created cloubuild.yaml file, then we built a trigger so that it can install and update the composer that is used for the app that we deploy. For Continuous Integration, the changes we make in the Github Repository code files, once changed, will automatically make the changes and run the trigger. There is no need for anyone to run the trigger as anytime changes are made to the code, it automatically triggers the build. When it comes to Monitoring or Operations, all the metrics that are created for the applications have to be checked every time and if the threshold exceeds, it should alert the user or the team that is handling the Dashboard. Even when the uptime checks are made for the application, when it goes down it should report to the user regarding the error that caused the application to be down.
Wrapping up…
If you have no basic knowledge about CI/CD and Monitoring tools, then getting started may be a challenge. CI/CD tools have to be properly connected to the right Repository to trigger the build. If you have not specified the proper file in the Repository, then the trigger won’t run automatically. Even when you want to monitor your application, if you don’t give proper metrics, then the data insight would not be meaningful for others to understand. In essence, you need to have the right knowledge to work on these services which is where our DevOps Services can help streamline the setup and management for you.
If you do, we hope this guide was helpful. Feel free to reach out with any comments or questions (connect@d3vtech.com).
But if you don’t..
Reach out for a free technical consultation with one of D3V’s experts on CI/CD and Monitoring tools today!